In Day 10, we built a Process Manager with a live visualization that subscribed to events and updated the UI in real time. That visualization was a Wire Tap: passively observing messages without affecting the primary flow.
Today we explore Wire Tap in depth and pair it with Control Bus for active management of distributed services. We’ll see how both patterns work in Kafka using Elixir.
Wire Tap: Passive Observation
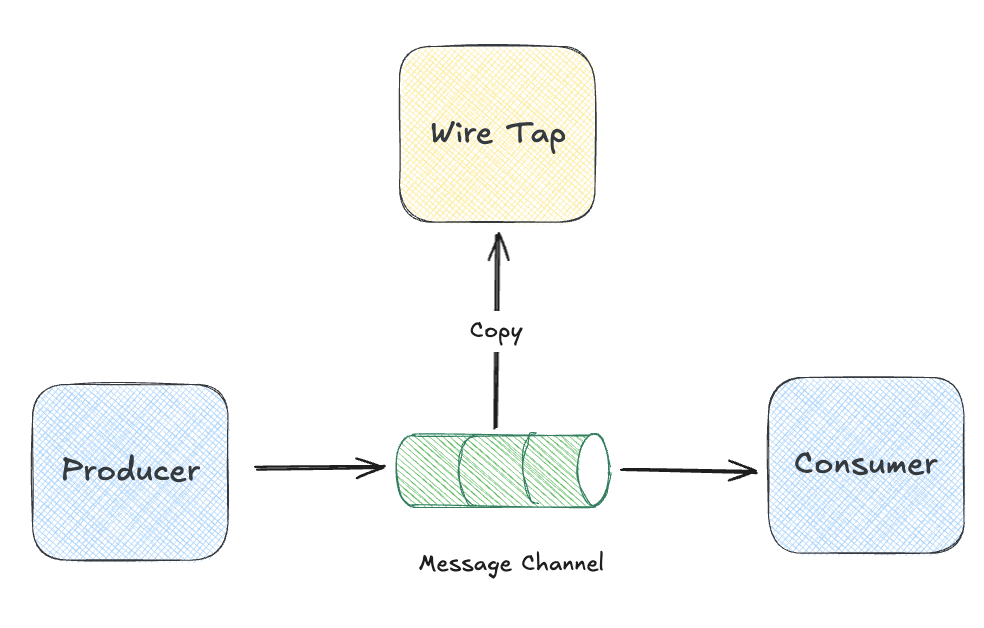
The Wire Tap pattern inserts a listener into a message channel that receives a copy of each message without affecting the primary flow. The name says it all: like tapping a phone line, you listen in without either party knowing you’re there.
Why would we want this?
- Debugging: See what’s flowing through a channel without modifying producers or consumers
- Auditing: Capture a record of all messages for compliance
- Analytics & Data Lakes: Stream events to warehouses, data lakes, or BI tools without touching your operational systems
- Testing: Verify message content in integration tests
The important characteristic is that the Wire Tap should be non-intrusive. The primary message flow must not be affected by the tap’s presence, performance, or failures.
Wire Tap in Kafka
Kafka’s architecture makes Wire Tap almost automatic. Because Kafka is a log, not a queue, multiple consumers can read the same messages independently.
Consumer Groups as Wire Taps
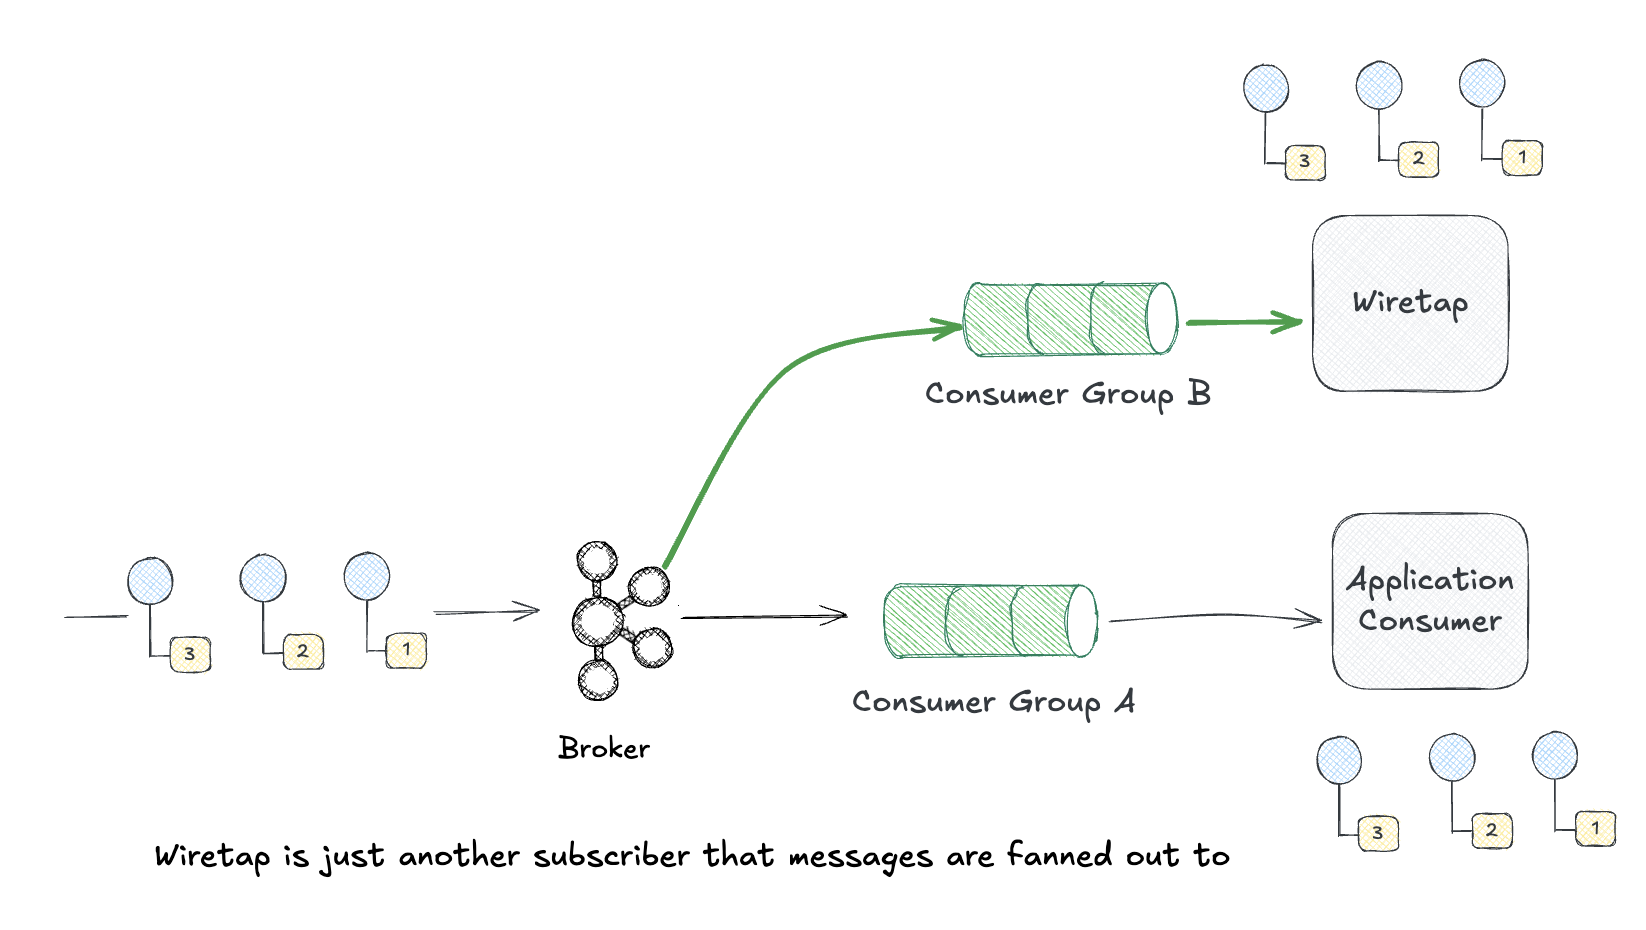
Any consumer group can read from a topic without affecting others. This is Wire Tap by default.
# Main processor - Consumer Group A
:brod.start_link_group_subscriber(
  :kafka_client,
  "order-processor",        # group_id
  ["orders"],               # topics
  _group_config = [],
  _consumer_config = [begin_offset: :earliest],
  StoreFront.OrderProcessor,
  []
)

# Wire Tap - Consumer Group B (completely independent)
:brod.start_link_group_subscriber(
  :kafka_client,
  "order-auditor",          # different group_id = independent consumer
  ["orders"],               # same topic
  _group_config = [],
  _consumer_config = [begin_offset: :earliest],
  StoreFront.AuditTap,
  []
)
Both consumers read all messages independently. The tap can fall behind, crash, or be paused without affecting the main processor.
Kafka Connect as Wire Tap
For tapping into Kafka and routing to external systems (S3, Elasticsearch, databases), Kafka Connect is the canonical approach:
{
  "name": "orders-s3-tap",
  "config": {
    "connector.class": "io.confluent.connect.s3.S3SinkConnector",
    "topics": "orders",
    "s3.bucket.name": "order-audit-archive",
    "format.class": "io.confluent.connect.s3.format.json.JsonFormat",
    "flush.size": 1000
  }
}
This creates a Wire Tap that streams all order messages to S3 for long-term archival without any code required.
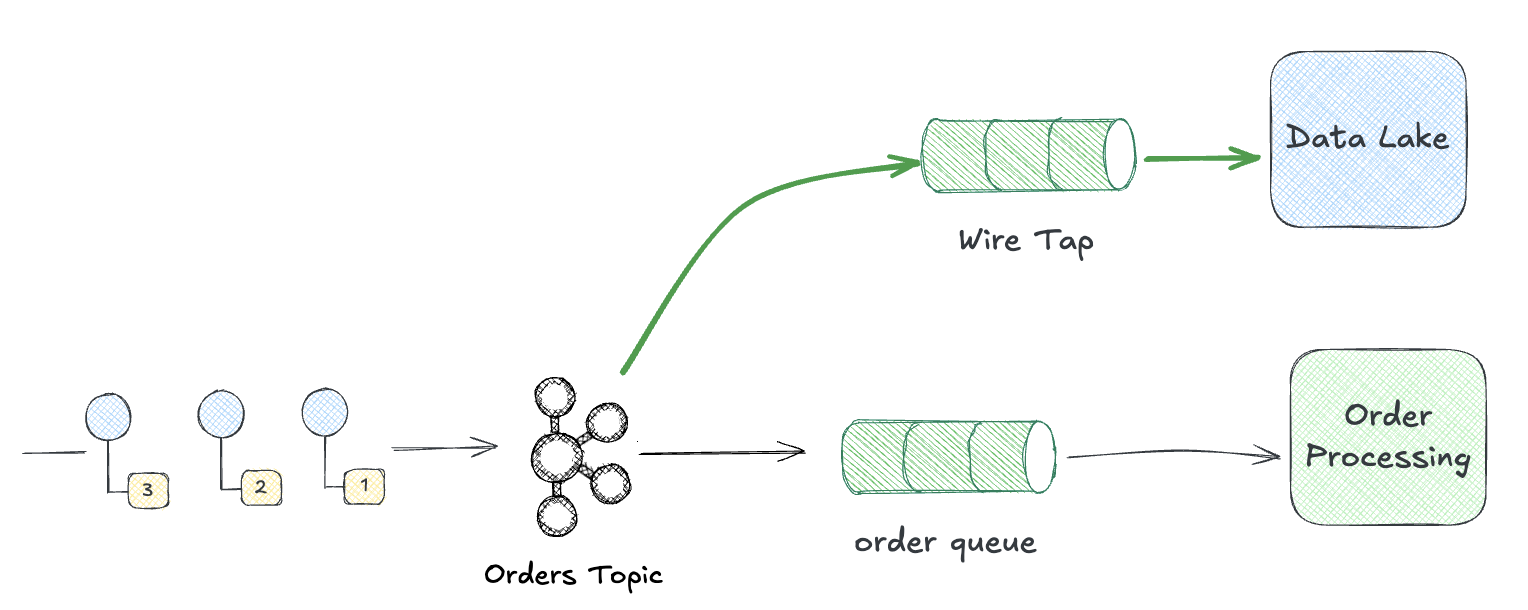
Wire Tap for Data Pipelines
One of the most valuable uses of Wire Tap is feeding data into analytics systems, data lakes, and warehouses. Your operational services stay focused on business logic while a tap silently copies events to your data platform. For example, most organizations the data team has infra in place that captures events sent to all topics fir analytics processing, machine learning, etc.
This pattern keeps your event-driven architecture cleanly separated from analytics concerns. Product teams publish events for operational purposes while data teams consume those same events for reporting, ML training, and business intelligence. Neither team needs to coordinate changes with the other.
Control Bus: Management via Messaging
The Control Bus pattern uses messaging to manage systems. Instead of SSH-ing into servers or clicking through UIs, you send command messages. But there are two distinct levels where this applies:
Infrastructure Control Bus manages the messaging system itself: creating topics, adjusting partitions, resetting consumer offsets, monitoring broker health. This is operational housekeeping.
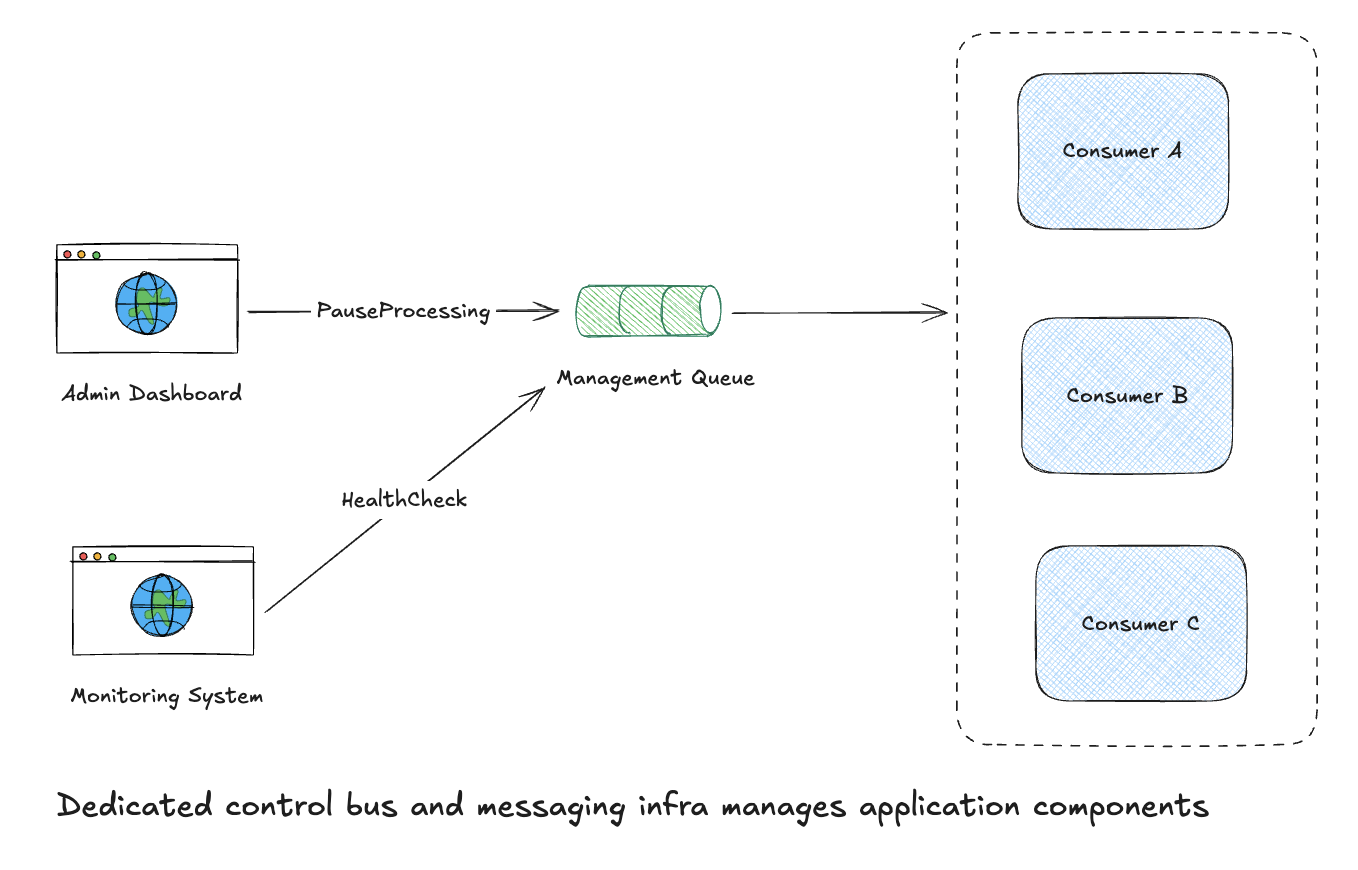
Application Control Bus manages your domain services via messaging: pause a processor, trigger a config reload, request a health check, tune the log level. Your services subscribe to a control topic and respond to commands just like any other message.
Why use messaging for management?
- Uniformity: Same patterns, same tooling, same observability as business messages
- Decoupling: Management commands don’t require direct network access to components
- Audit trail: Command messages can be logged just like any other message
- Automation: Easy to script and integrate with orchestration tools
Infrastructure Control Bus in Kafka
Kafka Admin API
Kafka’s Admin API is the infrastructure-level Control Bus that you may utilize from some management plane within your system to ensure the messaging topology is configured at scale.
# Using :brod for admin operations
:brod.create_topics(
  _hosts = [{"localhost", 9092}],
  _topic_configs = [
    %{
      name: "new-orders",
      num_partitions: 12,
      replication_factor: 3,
      assignments: [],
      configs: []
    }
  ],
  _request_configs = %{timeout: 5000}
)

# Delete consumer group (force reset)
:brod.delete_consumer_groups(:kafka_client, ["order-processor"])
Application Control Bus
At the domain level, your services can listen to a dedicated control topic and respond to commands and tune the runtime environment or even do some speciifc domain level processing.
defmodule StoreFront.ControlBus do
  use GenServer
  require Logger

  def start_link(opts), do: GenServer.start_link(__MODULE__, opts, name: __MODULE__)

  def init(_opts) do
    :brod.start_link_group_subscriber(
      :kafka_client,
      "control-bus-listener",
      ["app.control"],
      [],
      [begin_offset: :latest],
      __MODULE__,
      []
    )
    {:ok, %{paused: false}}
  end

  def handle_message(_topic, _partition, message, state) do
    message.value
    |> Jason.decode!()
    |> handle_command(state)
  end

  defp handle_command(%{"action" => "pause", "target" => target}, state) do
    Logger.info("Pausing #{target}")
    {:ok, :ack, state}
  end

  defp handle_command(%{"action" => "resume", "target" => target}, state) do
    Logger.info("Resuming #{target}")
    {:ok, :ack, state}
  end

  defp handle_command(%{"action" => "health_check", "reply_to" => topic}, state) do
    publish_health_status(topic)
    {:ok, :ack, state}
  end

  defp handle_command(%{"action" => "reload_config"}, state) do
    Application.put_env(:storefront, :config, load_config())
    {:ok, :ack, state}
  end

  # Domain-level command: reprocess failed orders for a customer
  defp handle_command(%{"action" => "reprocess_failed", "customer_id" => id}, state) do
    Logger.info("Reprocessing failed orders for customer #{id}")
    StoreFront.Orders.reprocess_failed(id)
    {:ok, :ack, state}
  end
end
Send commands from an admin tool:
# Pause a consumer
:brod.produce_sync(:kafka_client, "app.control", :hash, "control",
  Jason.encode!(%{action: "pause", target: "order-processor"}))

# Request health check with reply topic
:brod.produce_sync(:kafka_client, "app.control", :hash, "control",
  Jason.encode!(%{action: "health_check", reply_to: "admin.responses"}))
Kafka Connect REST API
Kafka Connect exposes a Control Bus via REST for managing connectors:
# Pause a connector
curl -X PUT localhost:8083/connectors/my-sink/pause

# Resume a connector
curl -X PUT localhost:8083/connectors/my-sink/resume

# Get connector status
curl localhost:8083/connectors/my-sink/status
Observability Tools
Modern distributed systems need more than ad-hoc Wire Taps. Here’s a brief tour of tools that provide Wire Tap capabilities at scale:
Kafka-Specific Tools
- Conduktor - Desktop and web UI for browsing topics, monitoring consumer lag, and managing schema registry
- Kafdrop - Lightweight web UI for viewing topics and consumer groups
- AKHQ - Full-featured Kafka management with topic browsing, consumer group tracking, and schema registry support
- Kafka UI - Open-source web interface for topic inspection and consumer monitoring
Distributed Tracing
OpenTelemetry implements Wire Tap at the application level. Instrument your Kafka producers and consumers to trace message flow:
def handle_message(message) do
  OpentelemetryTelemetry.start_telemetry_span(:storefront, "process_order", %{})
  |> Span.set_attributes([
    {"messaging.kafka.topic", message.topic},
    {"messaging.kafka.partition", message.partition},
    {"order_id", message.key}
  ])

  # Process message...

  Span.end_span()
end
Traces flow to Jaeger, Zipkin, or your APM of choice.
Log Aggregation as Wire Tap
Structured logging creates an implicit Wire Tap:
def handle_message(message) do
  Logger.info("message_received",
    message_id: message.offset,
    topic: message.topic,
    partition: message.partition,
    correlation_id: get_header(message, "correlation_id")
  )

  # Process message...
end
These logs flow to Datadog, Elastic, or Splunk where you can query and visualize message flow.
Wire Tap + Control Bus: Better Together
These patterns complement each other. Wire Tap tells you what’s happening. Control Bus lets you do something about it.
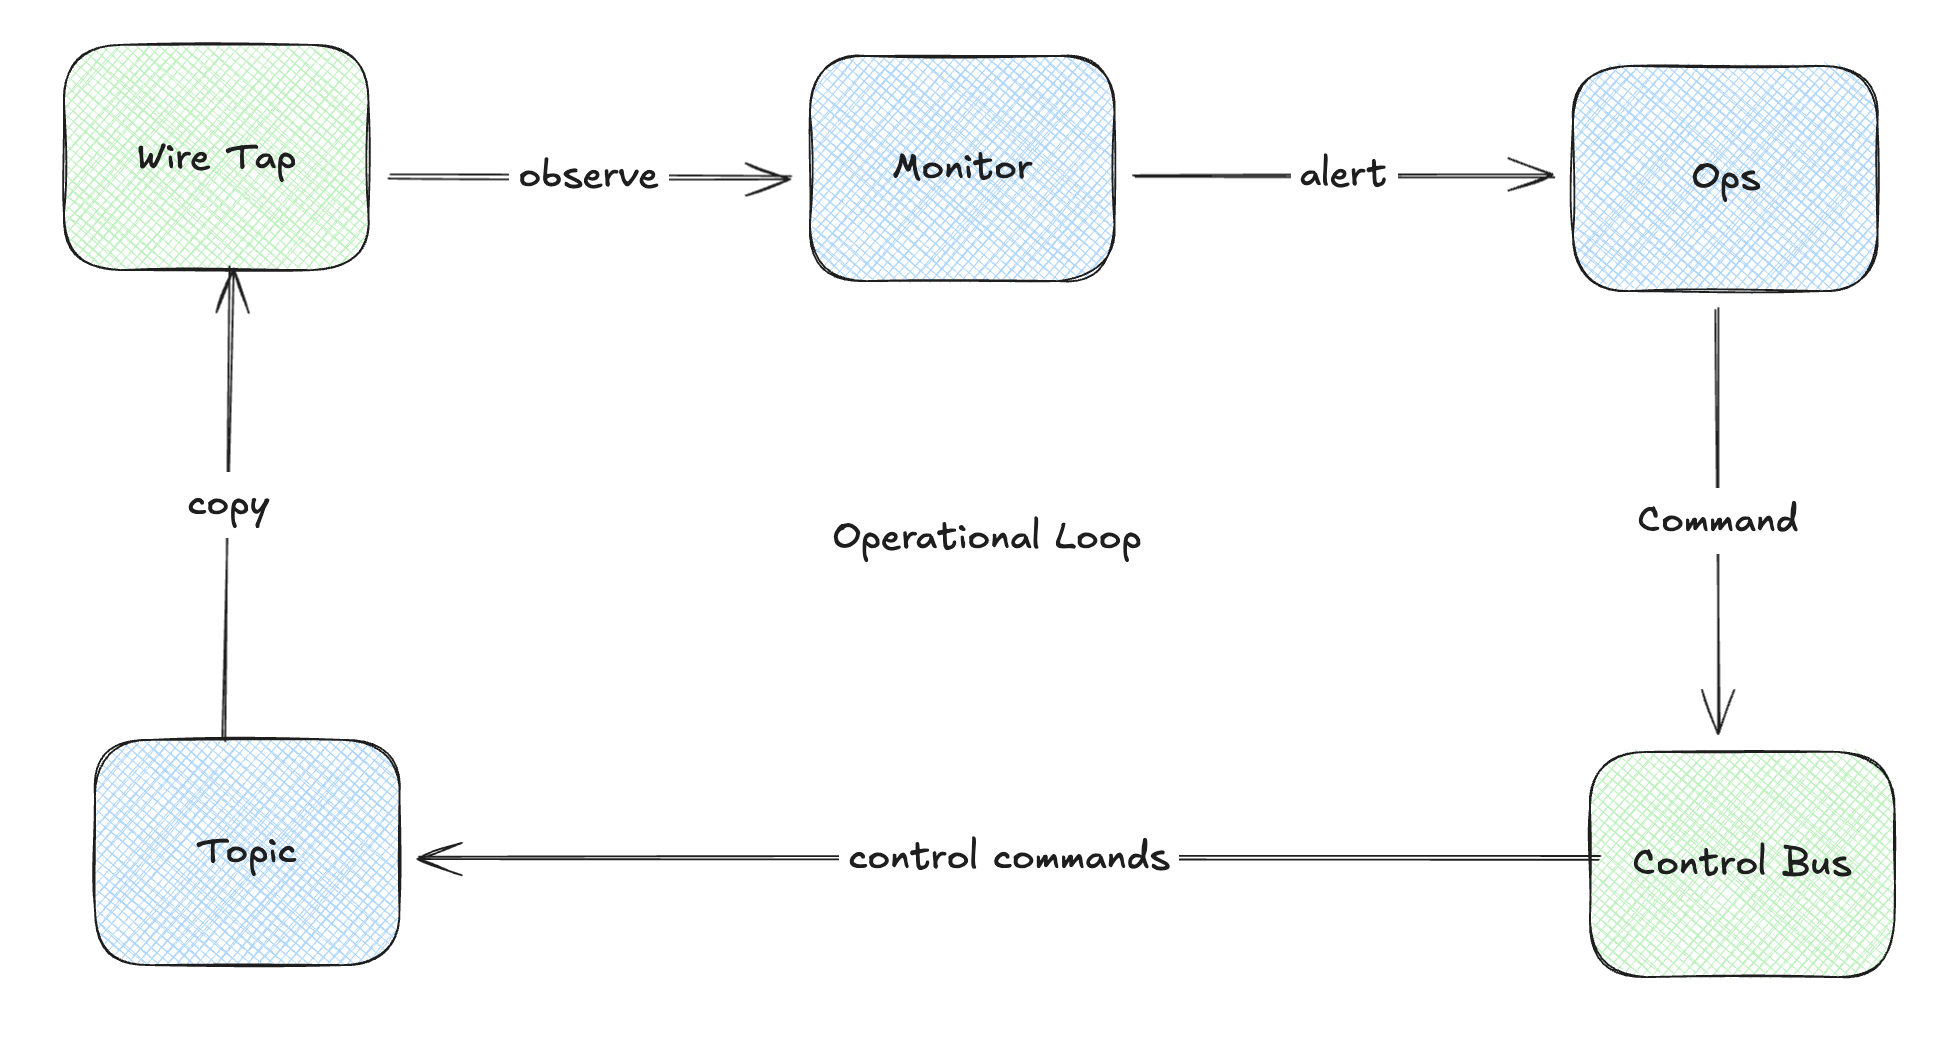
Example: Your Wire Tap (via consumer lag metrics) detects message processing is slowing down. Alert fires. Operator sends a Control Bus command to scale up consumers or pause a problematic downstream dependency.
A Note on Documenting Message Contracts
If you’re building Control Bus patterns at scale, you’ll want to formally document your command schemas. AsyncAPI is essentially OpenAPI for event-driven systems—it lets you define channels, message schemas, and protocol bindings for Kafka and more. I’ll explore AsyncAPI in a future post.
When to Use These Patterns
As I’ve demonstrated, these two patterns aren’t mutually exclusive. You may wind up using them separately or to compliment each other. Like all of the patterns, they’re tools you can leverage in the composition of your messaging management system.
Wire Tap when you need to:
- Debug message flow without modifying producers/consumers
- Audit messages for compliance
- Feed messages to analytics systems
- Test integrations in staging environments
Control Bus when you need to:
- Manage distributed components without direct access
- Automate operational tasks
- Create a uniform management interface
- Build self-healing systems that react to monitoring
The important aspect here is to treat messaging is infrastructure, and infrastructure needs to be managed and observed. Using messaging itself for that management creates uniformity and leverage across a distributed system.
References
📚 Wire Tap: Non-intrusive message inspection
📚 Control Bus: System management through messaging
Related patterns:
- Message Store: Persisting messages for replay
- Detour: Conditional routing for validation
- Message History: Tracking message path
What’s Next
We’ve covered the core patterns for building, routing, and managing message-driven systems. In the final post for this series I’m going to kind of bring it all together by exploring a couple of frameworks that provide implementations of these patterns that are ready to use.
Part of the Advent of Enterprise Integration Patterns series. Patterns from Enterprise Integration Patterns by Gregor Hohpe and Bobby Woolf.