Apologies for the long delay between posts, the new year kicked off extremely busy! Previously in Day 9, we explored the Routing Slip pattern, where messages carry their own itinerary. Each node was designed to route the message to the next destination based on the content of the routing slip and we had a small discussion about whether or not this was a form of choreography or orchestration since the route was computed up front.
But what happens when workflows get more complex? When you need to track state over hours or days? When external events need to trigger transitions? When humans need to intervene?
Today we dive into the Process Manager pattern: a central coordinator that orchestrates complex, long-running workflows while maintaining some form of state to make downstream decisions.
Orchestration vs Choreography
These two approaches represent fundamentally different ways to coordinate distributed work.
Choreography has no central controller. Each service knows what to do when it receives certain events. Our Day 9 Routing Slip is choreography: the message carries its itinerary, each node independently decides what’s next. The overall workflow emerges from these independent reactions.
Orchestration has a central Process Manager that directs the workflow, telling each service what to do and when, while tracking the state of the entire workflow.
| Choreography | Orchestration | |
|---|---|---|
| Mental model | “React to what happened” | “Do what you’re told” |
| Visibility | Harder to trace | Easy to query |
| Error handling | Each service handles its own | Centralized |
| Long-running workflows | Complex | Natural fit |
Most real systems use both. Choreography for loose coupling between bounded contexts, orchestration for complex workflows within a context.
When Orchestration Matters
This pattern hit differently when I read through it thoroughly and started experimenting.
I’ve built workflows like user offboarding and account cleanup, and even the webhook redelivery system from Day 8, using pure choreography. Messages flowed through pipes and filters, each service reacting independently. It worked, but some of the edge cases would come up by surprise when coordinating changes between services.
Account offboarding in particular: based on account size, team members, and which products they used, the route was different. Extra steps for enterprise accounts. Different cleanup for different integrations. Conditional branches everywhere.
We brute-forced our way through with choreography, and it worked. But something always felt off. Team members would occasionally voice it: “It feels like something should be tracking this process and making decisions.” We were describing a Process Manager without knowing the name.
Reading this pattern was like finding the word for something I’d been trying to say. A central coordinator that tracks state, handles conditional routing, and knows where each instance is in its journey. So much more convenient than scattering that logic across a dozen services.
The Process Manager Pattern
The Process Manager is the orchestrator. It builds and executes a state machine for each process instance, and the shape of that machine can vary based on context. A basic user’s offboarding might skip the asset transfer step entirely, while an enterprise user gets the full workflow. The Process Manager is the thing that knows “we’re waiting for the customer to confirm their shipping address before we can continue.”
The EIP book makes an important distinction between two different concepts within a process manager:
- Process Definition (Template): The static workflow structure. What steps exist, what transitions are valid, what conditions control routing.
- Process Instance: A runtime execution of a definition. Has a correlation ID, current state, context data, and intermediate results.
To make this concrete, here’s what a process definition might look like as an AWS Step Functions state machine:
{
  "Comment": "GDPR User Offboarding",
  "StartAt": "Initialize",
  "States": {
    "Initialize": {
      "Type": "Task",
      "Resource": "arn:aws:lambda:us-east-1:123:function:InitOffboarding",
      "Next": "GatherData"
    },
    "GatherData": {
      "Type": "Parallel",
      "Branches": [
        { "StartAt": "GatherProfile", "States": { "GatherProfile": { "Type": "Task", "Resource": "arn:aws:lambda:us-east-1:123:function:GatherProfile", "End": true }}},
        { "StartAt": "GatherDocuments", "States": { "GatherDocuments": { "Type": "Task", "Resource": "arn:aws:lambda:us-east-1:123:function:GatherDocuments", "End": true }}},
        { "StartAt": "GatherPreferences", "States": { "GatherPreferences": { "Type": "Task", "Resource": "arn:aws:lambda:us-east-1:123:function:GatherPreferences", "End": true }}}
      ],
      "Next": "CheckSharedAssets"
    },
    "CheckSharedAssets": {
      "Type": "Choice",
      "Choices": [{ "Variable": "$.hasSharedAssets", "BooleanEquals": true, "Next": "TransferAssets" }],
      "Default": "PackageExport"
    },
    "TransferAssets": {
      "Type": "Task",
      "Resource": "arn:aws:lambda:us-east-1:123:function:TransferAssets",
      "Next": "PackageExport"
    },
    "PackageExport": { "Type": "Task", "Resource": "arn:aws:lambda:us-east-1:123:function:PackageExport", "Next": "UploadToS3" },
    "UploadToS3": { "Type": "Task", "Resource": "arn:aws:lambda:us-east-1:123:function:UploadExport", "Next": "NotifyUser" },
    "NotifyUser": { "Type": "Task", "Resource": "arn:aws:lambda:us-east-1:123:function:SendNotification", "Next": "PurgeData" },
    "PurgeData": {
      "Type": "Parallel",
      "Branches": [
        { "StartAt": "PurgeProfile", "States": { "PurgeProfile": { "Type": "Task", "Resource": "arn:aws:lambda:us-east-1:123:function:PurgeProfile", "End": true }}},
        { "StartAt": "PurgeDocuments", "States": { "PurgeDocuments": { "Type": "Task", "Resource": "arn:aws:lambda:us-east-1:123:function:PurgeDocuments", "End": true }}},
        { "StartAt": "PurgePreferences", "States": { "PurgePreferences": { "Type": "Task", "Resource": "arn:aws:lambda:us-east-1:123:function:PurgePreferences", "End": true }}}
      ],
      "Next": "Complete"
    },
    "Complete": { "Type": "Succeed" }
  }
}
This JSON is the process definition. It declares the states, transitions, parallel branches, and conditional routing. When a user requests offboarding, Step Functions creates a process instance from this template—with its own execution ARN (the correlation ID), input data (context), and tracked state as it progresses through each step.
This separation is powerful. One process definition (“GDPR Offboarding”) can have thousands of active instances, each tracking a different user’s journey through the offboarding process.
The Example: GDPR User Offboarding
Let’s make this concrete with a real-world workflow: GDPR-compliant user offboarding.
When a user requests their data and account deletion, we need to:
- Gather their data from multiple sources (profile, documents, activity logs, etc.)
- Transfer shared assets to a successor (if they have any)
- Package everything into a downloadable ZIP
- Upload to an archive service and generate a download link
- Notify the user their export is ready
- Purge all their data from our systems
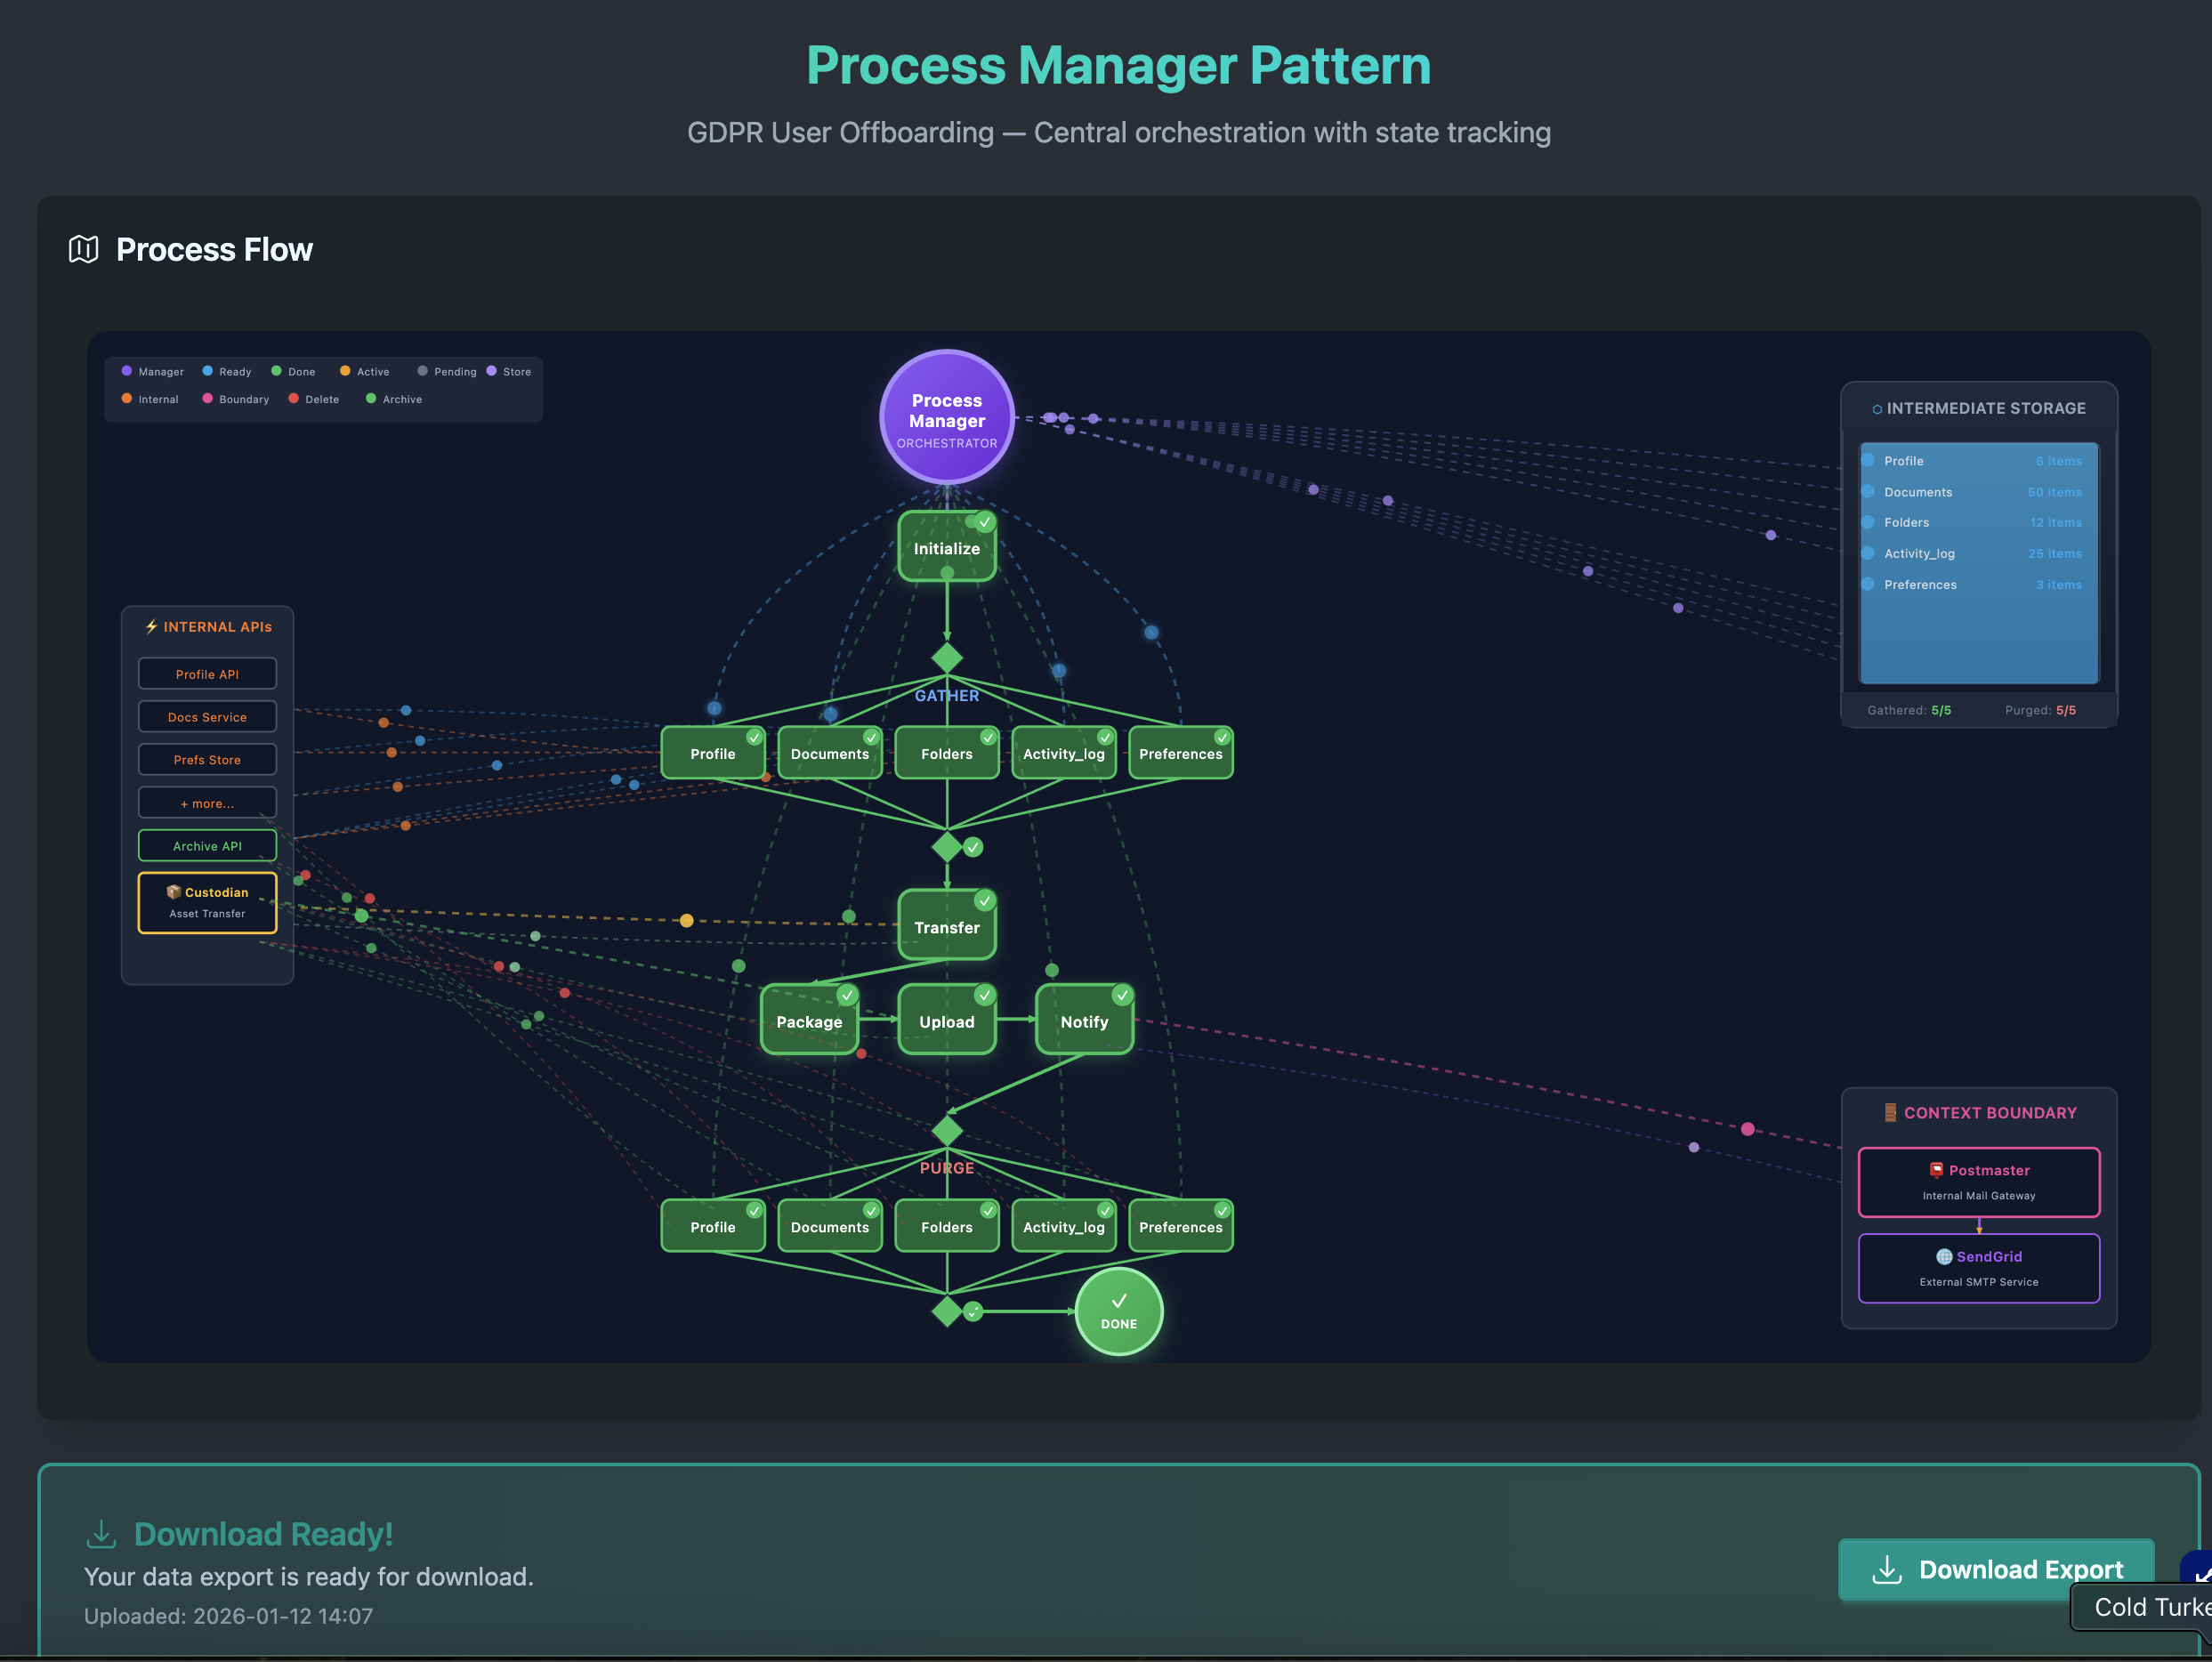
The application has a flowchart that updates based on the scenario and the animation illustrates different processes executing in parallel while showing the flow of events to request / reply channels, plus emitting events that the process manager uses to track progress in an intermediate state. Will dig into the details in a bit, but here is what it looks like in its complete form.
This workflow shows off several of the patterns we have been talking about over the past weeks, brought together with a single “brain” to observe, coordinate and make decisions.
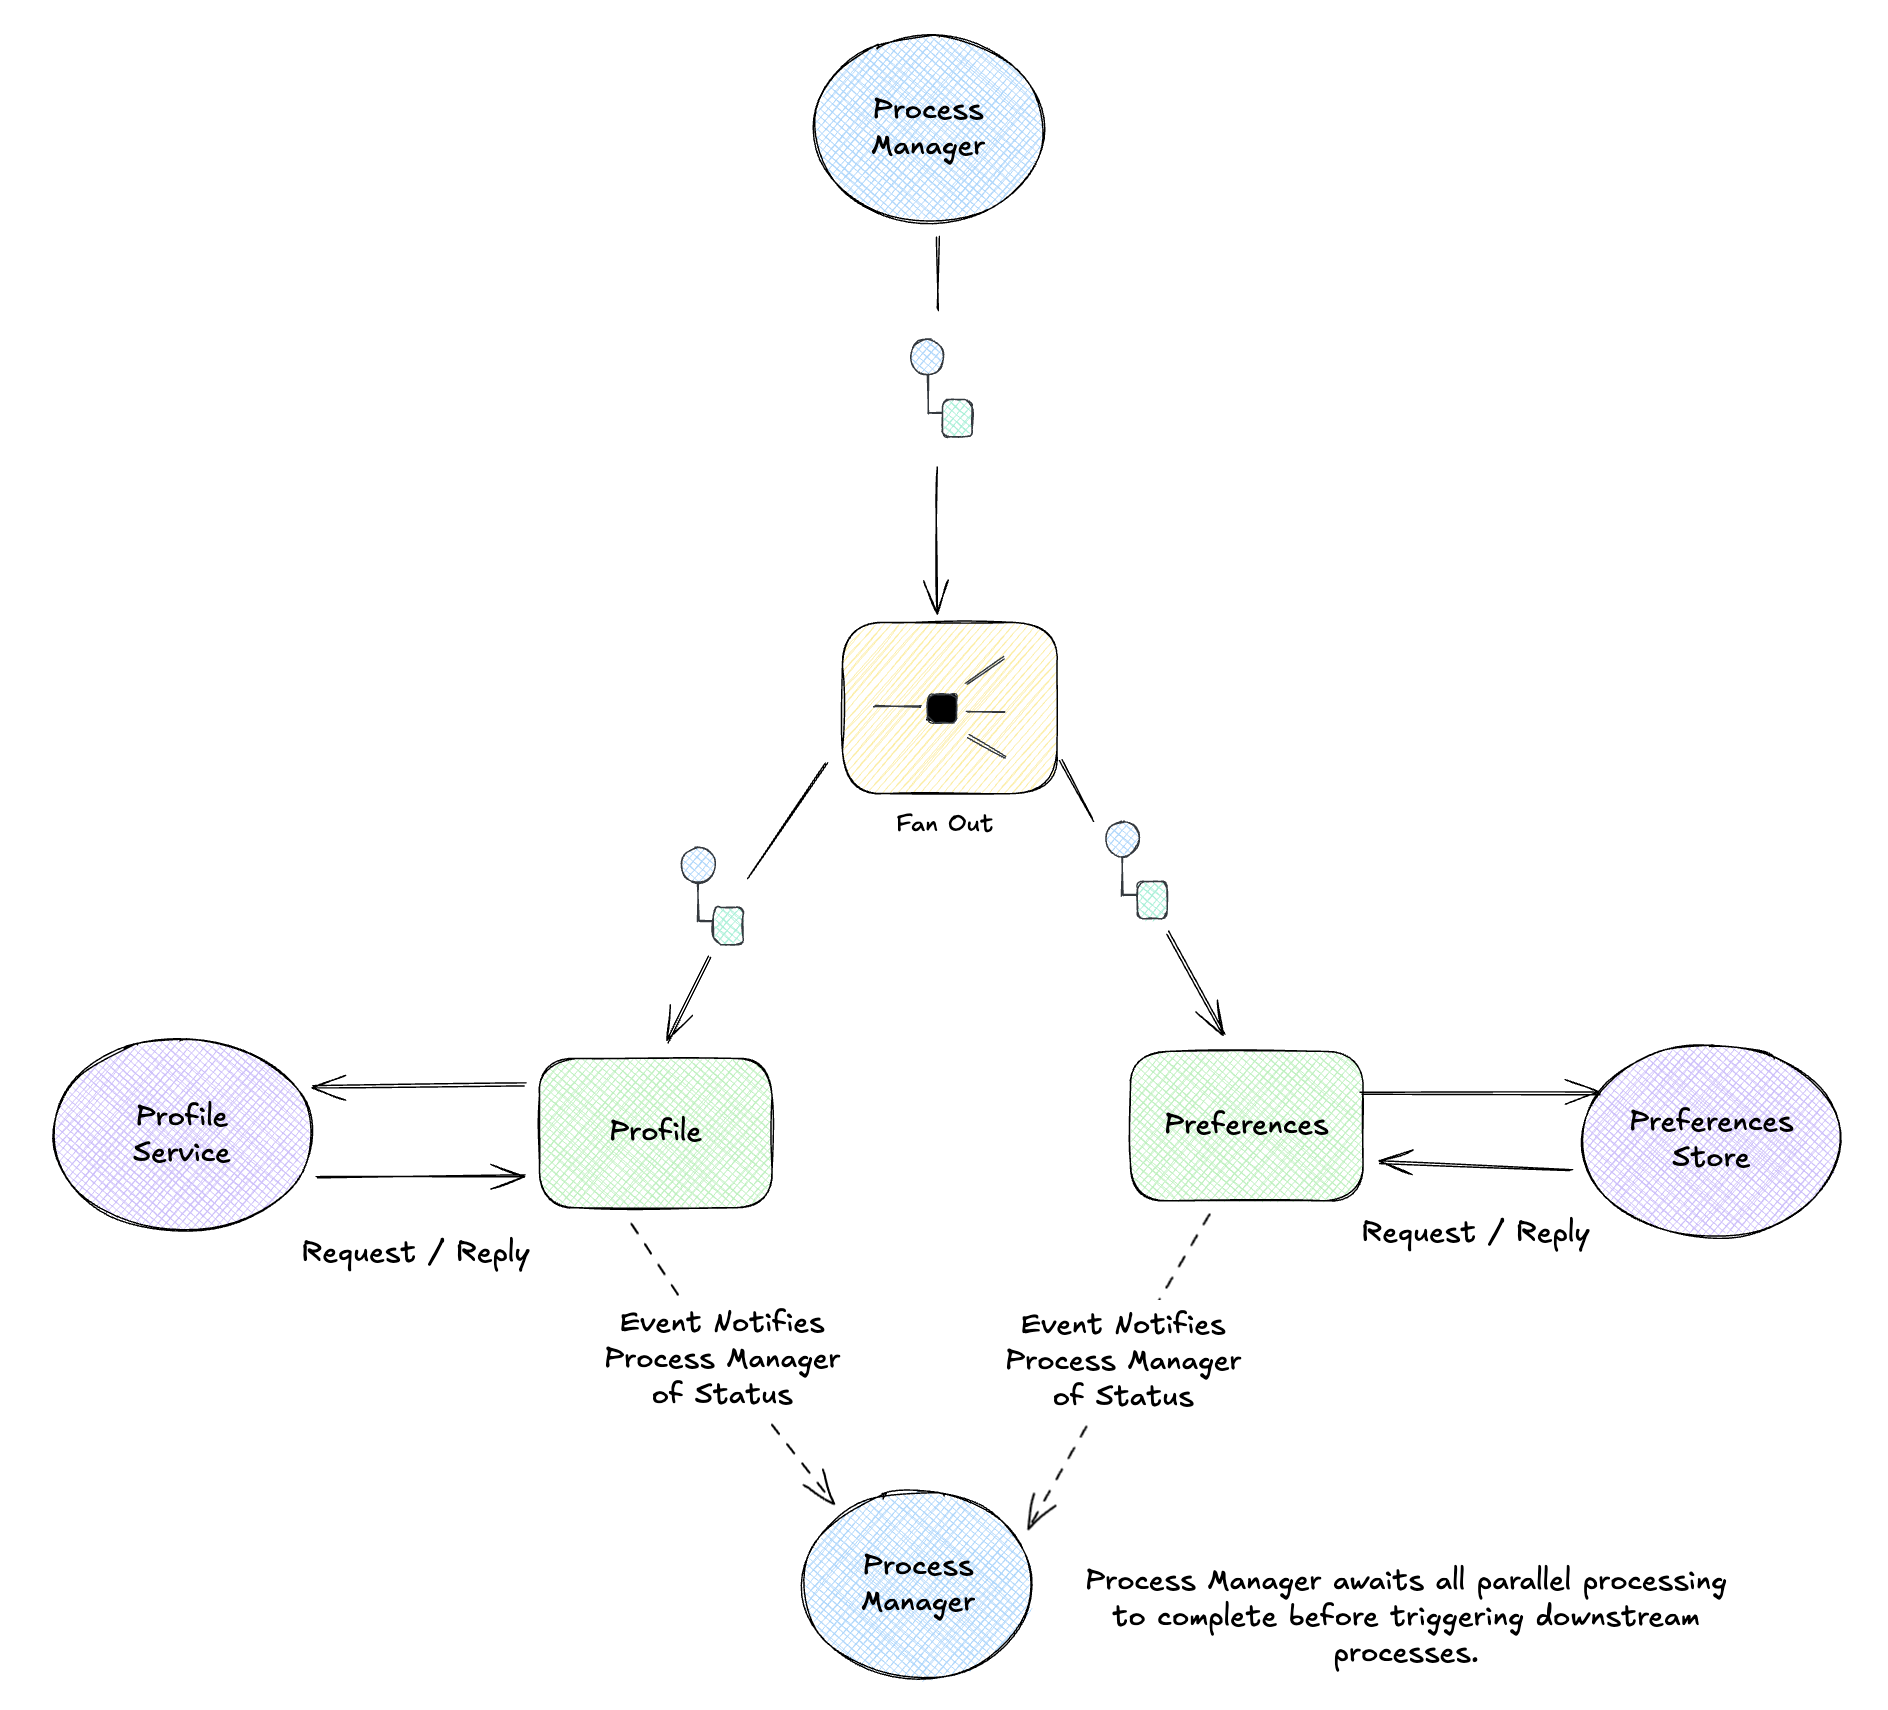
Scatter/Gather for Parallel Work
The gathering and purging phases need to hit multiple independent data sources: profile, documents, folders, activity logs, preferences, integrations, API keys. They can run in parallel.
The Process Manager scatters work to all sources, then gathers the results before moving on. In the UI, you can watch individual tasks complete independently… “Gather Profile” finishes before “Gather Documents”… and the Process Manager waits for all of them before proceeding.
Conditional Routing
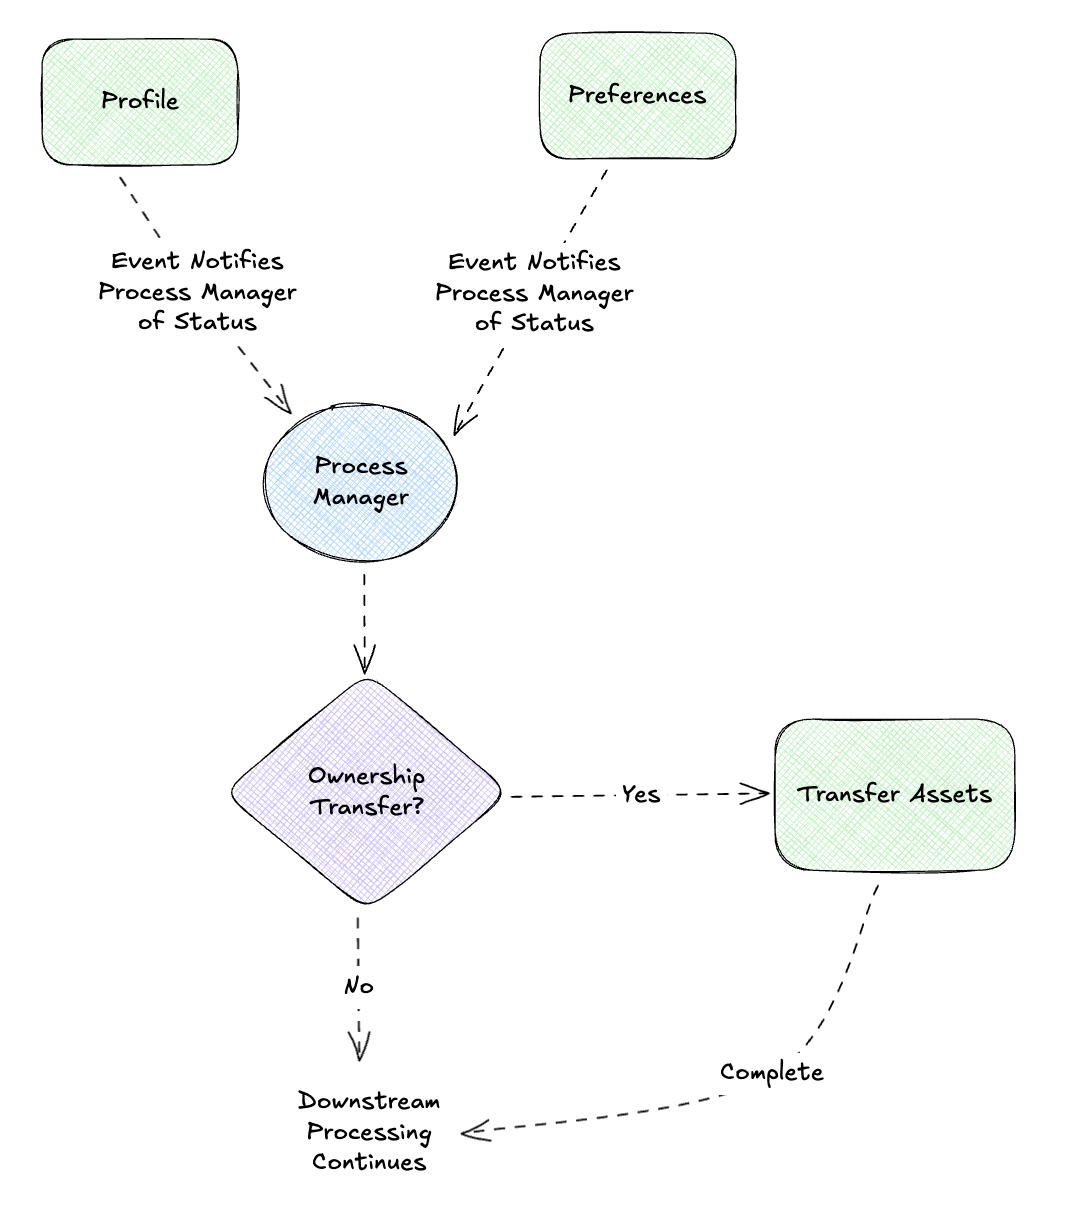
Not all users follow the same path. A user with shared folders needs an extra Transfer Assets step; a basic user skips straight to packaging. The process definition includes conditions, and each instance follows the appropriate path based on its context.
Correlation IDs and Message History

Remember correlation and causation IDs from Day 4? They’re essential here. The correlation ID ties all messages in a workflow back to the same business transaction—every command the Process Manager sends and every event it receives carries the same correlation ID (e.g., gdpr-req-12345). When the Docs Service finishes gathering documents, it includes that correlation ID in its completion event so the Process Manager knows which instance to update.
The causation ID creates the chain: each completion event’s causation ID points to the command that triggered it. So DocumentsGathered has a causation ID pointing to the GatherDocuments command. This lets you trace not just which workflow a message belongs to, but what triggered it.
For auditability, we track every event. When something goes wrong, you can trace exactly what happened:
✓ Process initialized (correlation: gdpr-req-12345)
✓ Task Gather Profile started (causation: cmd-001)
✓ Task Gather Documents started (causation: cmd-002)
✓ Task Gather Profile done ✓ (causation: cmd-001)
✓ Task Gather Documents done ✓ (causation: cmd-002)
✓ Step gathering completed ✓
...
Intermediate Results and Storage
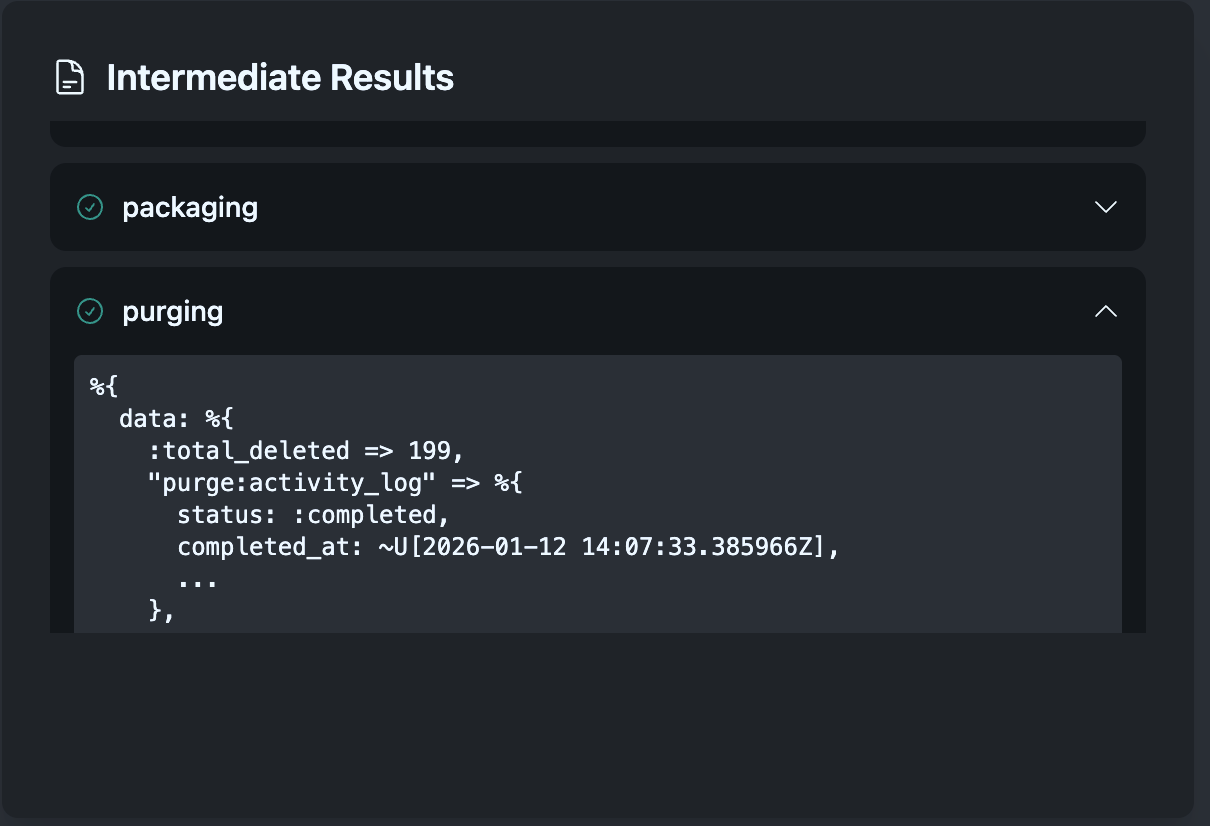
Each step stores results that downstream steps need. Gathering stores collected data → Packaging uses it to build the ZIP → Upload stores the archive location → Notification uses that to send the download link. This flow of data through the workflow is what makes complex processes possible.
The Process Manager maintains intermediate storage where step results accumulate. This isn’t just convenient—it’s essential for recovery. If the process fails mid-flight, we can resume from the last successful step because all prior results are preserved.
Message Types in the Workflow
Back in Day 5, we explored the three fundamental message types: Commands (imperatives), Events (facts), and Documents (data carriers). All three flow through this workflow, and the Process Manager sits at the center routing between them.
Commands flow outward—the Process Manager issues imperatives to services:
┌─────────────────────┐      Command: GatherDocuments
│   Process Manager   │ ────────────────────────────────► Docs Service
│   (Orchestrator)    │      {user_id, correlation_id}
└─────────────────────┘
Events flow inward—services report what happened, triggering state transitions:
┌─────────────────────┐      Event: DocumentsGathered
│    Docs Service     │ ────────────────────────────────► Process Manager
│                     │      {correlation_id, doc_count, status}
└─────────────────────┘
Documents accumulate—data payloads flow into intermediate storage for downstream steps:
┌─────────────────────┐      Document: UserProfileData
│    Profile API      │ ────────────────────────────────► Gather Task
│                     │      {profile, preferences, settings}
└─────────────────────┘
             │
             ▼
      ┌──────────────┐
      │ Intermediate │   Document Messages accumulate
      │   Storage    │   for downstream steps
      └──────────────┘
The Process Manager acts as a Message Router, receiving events and dispatching commands based on the current state. It also serves as a Content Enricher, adding correlation context to outbound commands.
System Interactions and Context Boundaries
The visualization shows different types of system interactions:
Internal APIs
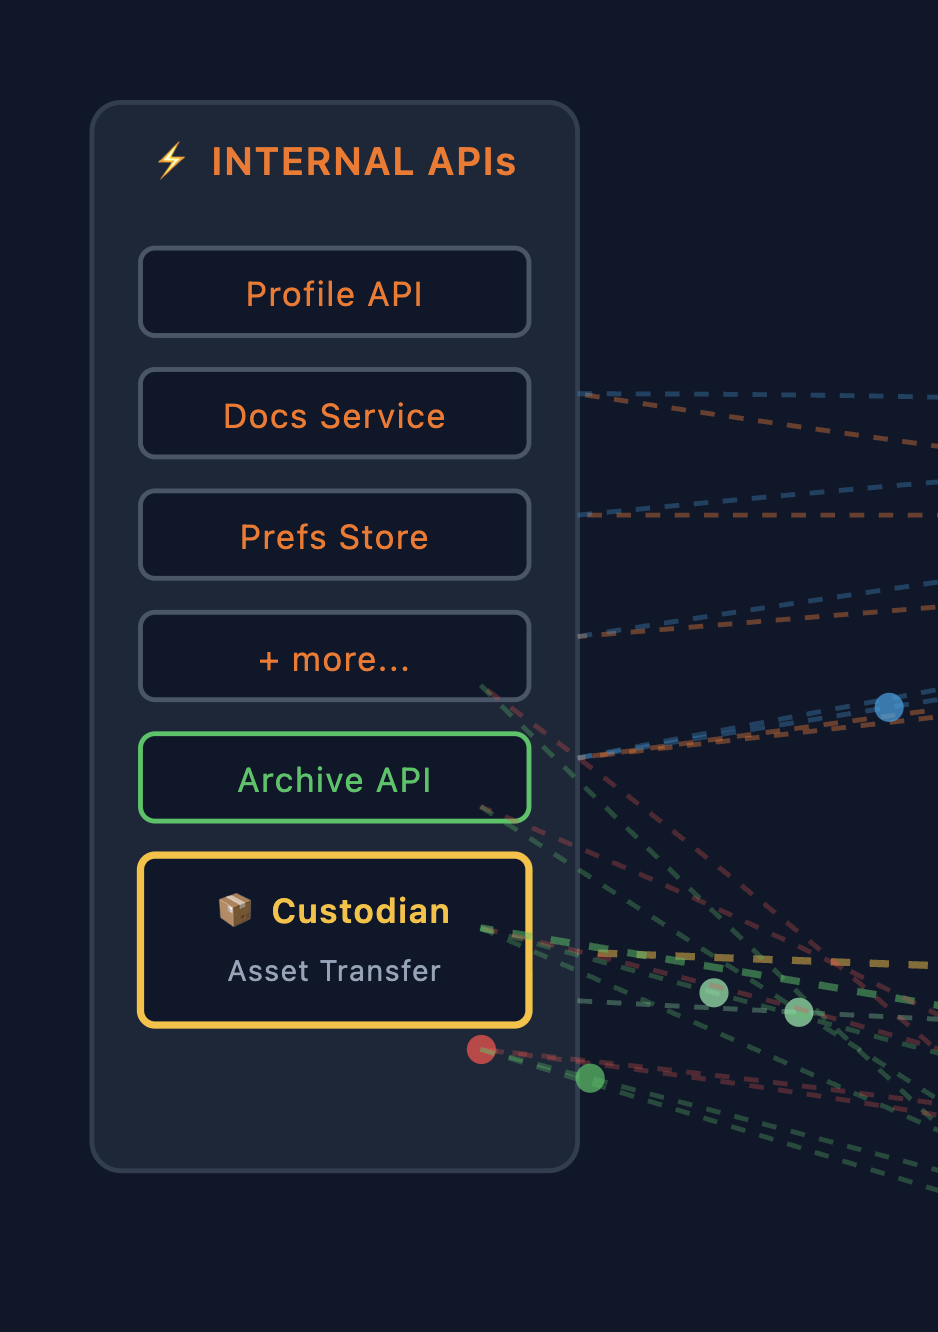 Within our bounded context, the Process Manager communicates with internal services:
- Profile API: User account data
- Docs Service: Documents and files
- Prefs Store: User preferences
- Archive API: Long-term storage for exports
- Custodian: Asset transfer service (for shared resources)
These services speak the same domain language and share the same deployment context. Communication is typically synchronous request/response or async via internal message queues.
Context Boundaries (Gateways)
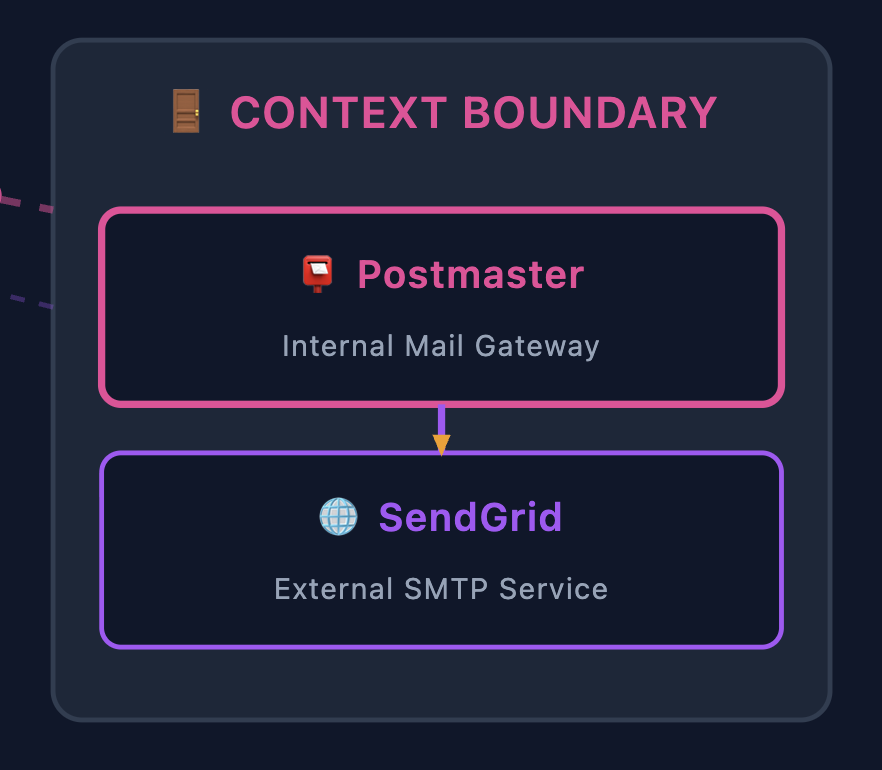 When communicating outside our bounded context, we use Gateway services that act as context boundaries. Claude Code took me a little too literally when I asked it to put a box around the context boundary here but it’s good enough. In our example:
Postmaster is the internal mail gateway. Rather than calling SendGrid directly from the Process Manager, we send to Postmaster, which:
- Translates our domain concepts to the external API
- Handles authentication and rate limiting
- Provides a stable interface even if the external provider changes
- Manages retries and delivery confirmation
┌─────────────────┐     ┌─────────────────┐     ┌─────────────────┐
│  Notify Step    │────►│   Postmaster    │────►│    SendGrid     │
│  (internal)     │     │   (gateway)     │     │   (external)    │
└─────────────────┘     └─────────────────┘     └─────────────────┘
        Domain                 Context               Third-party
        Command               Boundary                  API
This pattern—internal gateway wrapping external services—keeps external dependencies from leaking into your domain logic.
Data Flow Through the Process
Let’s trace how data flows through the complete workflow:
1. INITIALIZE
   ├── Command: StartOffboarding {user_id, context}
   └── Process Manager creates instance, determines routes

2. GATHER (Scatter/Gather)
   ├── Commands: GatherProfile, GatherDocs, GatherPrefs... (scattered)
   ├── Internal APIs return Document Messages with user data
   ├── Events: ProfileGathered, DocsGathered... (gathered)
   └── Process Manager stores results in Intermediate Storage

3. TRANSFER (conditional)
   ├── Command: TransferAssets {assets, successor_id}
   ├── Custodian service handles ownership change
   └── Event: AssetsTransferred

4. PACKAGE
   ├── Reads Document Messages from Intermediate Storage
   └── Produces archive package

5. UPLOAD
   ├── Command: StoreArchive {package}
   ├── Archive API stores and returns location
   └── Event: ArchiveStored {download_url, expiry}

6. NOTIFY
   ├── Command: SendNotification {user_email, download_url}
   ├── Postmaster (gateway) → SendGrid (external)
   └── Event: NotificationSent

7. PURGE (Scatter/Gather)
   ├── Commands: DeleteProfile, DeleteDocs... (scattered)
   ├── Internal APIs confirm deletions
   ├── Events: ProfileDeleted, DocsDeleted... (gathered)
   └── Event: OffboardingComplete
Each step produces data that subsequent steps consume. The Process Manager orchestrates this flow, ensuring steps execute in the correct order and all parallel work completes before proceeding. This simple example ignores the fact that we may get large results back that require a kind of Claim Check to track the storage, but the intermediate storage is simply a MessageStore used to aggregate data downstream.
But What About Failures?
Everything above describes the happy path. In reality, every single one of those API calls can fail:
- Profile API returns a 503 during peak load
- Docs Service times out because the user has 50,000 files
- Archive API rejects the upload due to a malformed request
- SendGrid rate-limits us because we’re processing a batch
- The entire Process Manager crashes mid-workflow
For a convenience feature, you might accept “sorry, try again later.” But GDPR compliance isn’t optional. When a user requests data deletion, we must complete that request. Partial completion isn’t acceptable—leaving orphaned data in some systems while others are purged violates the regulation.
This is where the Process Manager pattern really earns its keep.
Building on What We Learned
Remember our webhook delivery system from Day 8? We built retry logic with exponential backoff, dead letter queues for undeliverable webhooks, and idempotent receivers. Those same patterns apply here—but they live in the scattered services, not the Process Manager itself.
The point here: the Process Manager delegates retry mechanics to the services it coordinates.
Distributed Retry Responsibility
When the Process Manager scatters work to multiple services, each service handles its own retry logic independently. The Process Manager simply tracks telemetry—it knows what state each component is in, not how they’re achieving that state.
                              ┌─────────────────────┐
                              │   Process Manager   │
                              │  (State Tracking)   │
                              └─────────┬───────────┘
                                        │ scatter
               ┌────────────────────────┼────────────────────────┐
               │                        │                        │
               ▼                        ▼                        ▼
    ┌──────────────────┐    ┌──────────────────┐    ┌──────────────────┐
    │  Profile Service │    │   Docs Service   │    │   Prefs Service  │
    │  ┌─────────────┐ │    │  ┌─────────────┐ │    │  ┌─────────────┐ │
    │  │ Retry Queue │ │    │  │ Retry Queue │ │    │  │ Retry Queue │ │
    │  └──────┬──────┘ │    │  └──────┬──────┘ │    │  └──────┬──────┘ │
    │         ▼        │    │         ▼        │    │         ▼        │
    │  ┌─────────────┐ │    │  ┌─────────────┐ │    │  ┌─────────────┐ │
    │  │ Profile API │ │    │  │  Docs API   │ │    │  │  Prefs API  │ │
    │  └─────────────┘ │    │  └─────────────┘ │    │  └─────────────┘ │
    └────────┬─────────┘    └────────┬─────────┘    └────────┬─────────┘
             │                       │                       │
             │ status: done          │ status: retrying      │ status: done
             └───────────────────────┴───────────────────────┘
                                     │
                              ┌──────▼──────┐
                              │   Process   │
                              │   Manager   │
                              │ "2/3 done"  │
                              └─────────────┘
Each scattered service is event-driven and self-sufficient:
Profile Service:                      Process Manager sees:
──────────────────                    ─────────────────────
Attempt 1: 503 → retry in 1s          status: in_progress
Attempt 2: 503 → retry in 2s          status: in_progress
Attempt 3: 503 → retry in 4s          status: in_progress
Attempt 4: 200 ✓                      status: completed
  └── emit "ProfileGathered" event        └── update state machine
The Process Manager doesn’t know or care about the retry mechanics. It just receives events: ProfileGathered, DocsGathered, PrefsGathered. When all expected events arrive, it transitions to the next state.
Why This Separation Matters
Centralizing retries in the Process Manager creates a bottleneck and couples it to every API’s error modes. Instead:
| Concern | Owned By |
|---|---|
| Retry policy | Individual service (knows its API’s rate limits) |
| Backoff timing | Individual service (can tune per-API) |
| Circuit breaking | Individual service (local failure detection) |
| State transitions | Process Manager (workflow coordination) |
| Timeout/SLA | Process Manager (business rules) |
The Process Manager might say “if Docs Service hasn’t reported done in 30 minutes, escalate.” But it doesn’t know why Docs Service is slow—could be retries, could be processing a huge file. That’s an implementation detail.
State Persistence and Recovery
What if the Process Manager itself crashes? The state must survive restarts.
┌─────────────────────────────────────────────────────────────────┐
│                     Persistent Store                            │
├─────────────────────────────────────────────────────────────────┤
│  process_id: "gdpr-req-12345"                                   │
│  current_state: "gathering"                                     │
│  started_at: "2026-01-10T14:30:00Z"                             │
│  ┌─────────────────────────────────────────────────────────┐    │
│  │ intermediate_results:                                   │    │
│  │   profile: { status: "done", gathered_at: "..." }       │    │
│  │   docs:    { status: "in_progress" }                    │    │
│  │   prefs:   { status: "done", gathered_at: "..." }       │    │
│  └─────────────────────────────────────────────────────────┘    │
└─────────────────────────────────────────────────────────────────┘
                              │
                              │ On restart
                              ▼
┌─────────────────────────────────────────────────────────────────┐
│  Process Manager reconstructs:                                  │
│  - Profile: done (skip)                                         │
│  - Docs: in_progress (wait for event or timeout)                │
│  - Prefs: done (skip)                                           │
│                                                                 │
│  → Still waiting on 1 of 3 components                           │
└─────────────────────────────────────────────────────────────────┘
Before each state transition, the Process Manager persists:
- Current step in the workflow
- Intermediate results from completed components
- Correlation ID and context
On restart, it reconstructs in-flight processes and resumes from where they left off. The scattered services are independently retrying—the Process Manager just needs to wait for their completion events.
This is why intermediate results matter so much—they’re not just for passing data downstream, they’re checkpoints that enable recovery.
Dead Letter Queues and Human Intervention
Some failures can’t be retried away. An API might require manual data cleanup, or there’s a bug in a scattered service. When a service exhausts its retries, it publishes a failure event and moves the message to its Dead Letter Queue (DLQ).
┌───────────────────┐         ┌─────────────────┐
│  Profile Service  │         │ Process Manager │
│                   │         │                 │
│  Attempt 5: 500   │  event  │                 │
│  Max retries hit  │────────▶│ "Profile failed │
│  → Move to DLQ    │         │  after 5 tries" │
│                   │         │                 │
└───────────────────┘         └────────┬────────┘
                                       │
                                       ▼
                              ┌─────────────────┐
                              │  Transition to  │
                              │  "needs_review" │
                              │  state          │
                              └─────────────────┘
The Process Manager receives a “component failed” event and transitions the workflow to a review state. It doesn’t manage the DLQ—that’s the service’s responsibility. But it knows the overall process needs intervention.
For GDPR compliance, this state transition might trigger escalation: notify the data protection team, create a support ticket, start an SLA timer. The process isn’t abandoned—it’s handed off to humans who can resolve the underlying issue.
Idempotency: Safe Retries
Retrying commands is only safe if the operations are idempotent—running them twice produces the same result as running them once.
DeleteProfile(user_id: "123")
DeleteProfile(user_id: "123")  ← Must not fail or double-delete

GatherDocuments(user_id: "123")
GatherDocuments(user_id: "123")  ← Must return same documents
This pushes requirements onto the services we call. They need to handle duplicate requests gracefully—usually by checking “is this already done?” before doing work.
The Full Picture
Reliability is a distributed responsibility. Each layer owns its piece:
| Layer | Mechanism | Purpose |
|---|---|---|
| Scattered Services | Retry Queue | Automatic recovery from transient API failures |
| Scattered Services | Exponential Backoff | Prevents thundering herd, respects rate limits |
| Scattered Services | Circuit Breaker | Stops hammering a failing dependency |
| Scattered Services | Dead Letter Queue | Park unprocessable messages for review |
| Process Manager | State Persistence | Survives crashes, enables workflow resume |
| Process Manager | Intermediate Results | Checkpoints for skip-ahead recovery |
| Process Manager | Timeout/SLA Tracking | Business-level escalation when components stall |
| Both | Idempotent Operations | Safe retries without side effects |
┌─────────────────────────────────────────────────────────────┐
│                     Reliability Layers                      │
├─────────────────────────────────────────────────────────────┤
│                                                             │
│  Process Manager:  Workflow state, timeouts, escalation     │
│  ─────────────────────────────────────────────────────────  │
│                                                             │
│  Services:         Retries, backoff, DLQ, circuit breakers  │
│  ─────────────────────────────────────────────────────────  │
│                                                             │
│  APIs:             Idempotency, rate limits                 │
│                                                             │
└─────────────────────────────────────────────────────────────┘
This separation keeps the Process Manager focused on what should happen in the workflow, while individual services handle how to reliably interact with their dependencies. The happy path is 10% of the code; handling everything that can go wrong is the other 90%.
Running the Example
The full implementation lives in the routing_examples repository:
cd routing_examples
docker-compose up -d  # Starts LocalStack for S3
mix deps.get
mix phx.server
Visit http://localhost:4000/process-manager and try different scenarios:
- Basic User: 3 data sources, no transfer step
- Team Admin: Has shared assets, includes transfer step
- Large Data User: Many data sources, longer gathering phase
- Enterprise User: Full path with all features
Watch the Process Manager coordinate each step, see individual tasks complete during scatter/gather, and download the final export.
When to Use What
After building both Routing Slip and Process Manager examples, here’s how I think about the choice:
| Aspect | Routing Slip | Process Manager |
|---|---|---|
| State location | In the message | In the coordinator |
| Visibility | Follow the message | Query the coordinator |
| Human intervention | Difficult | Built-in |
| Complexity | Simple, linear | Complex, branching |
| Duration | Seconds to minutes | Minutes to days |
| Recovery | Replay the message | Reconstruct from stored state |
Routing Slip: “This message needs to visit these services in order, then we’re done.”
Process Manager: “This workflow might take hours, needs external events, and operators might need to intervene.”
Think of it as a spectrum:
Simple ◄────────────────────────────────────────► Complex

Routing Slip              Process Manager         Workflow Engine
(state in message)        (external state)        (distributed)

- Pub/Sub pipelines       - GDPR offboarding      - Temporal
- ETL transforms          - Order fulfillment     - Cadence
                          - Multi-step approvals  - Camunda
The further right, the more visibility and control, but also more operational complexity.
References
📚 Process Manager Pattern: The original from Hohpe and Woolf
Related patterns:
- Scatter-Gather: Parallel fan-out and collection
- Correlation Identifier: Tracking related messages
- Command Message: Messages that invoke procedures
- Event Message: Messages that notify about something that happened
- Document Message: Messages that carry data between systems
- Message Router: Routing messages based on conditions
- Content Enricher: Adding data to messages
- Idempotent Receiver: Safe message reprocessing
- Dead Letter Channel: Handling undeliverable messages
Process Managers in the Wild
Looking back over my career, I’ve used implementations of this pattern without knowing the name. The pattern is everywhere, just wearing different clothes.
The Old Guard
Batch schedulers were early Process Managers. Tools like Control-M and Autosys orchestrated nightly batch jobs: “Run the extract at 2am, wait for completion, then run the transform, then load into the warehouse.” They tracked state (job status), handled dependencies (don’t start until upstream completes), and supported conditional routing as well as all kinds of patterns we’ve spoken about so far. I always recall how the UI was so painful and the XML configurations were verbose, but they were solving the same problem.
ETL platforms like Informatica, SSIS, and Talend embedded Process Managers for data pipelines. The visual designers with boxes and arrows? That’s a process definition. Each execution? A process instance.
Modern Data Orchestration
The data engineering world reinvented process management with Python-native tooling. Apache Airflow became the de facto standard—DAGs as code, a massive plugin ecosystem, and battle-tested at scale. Alternatives like Dagster took different approaches (asset-centric modeling, stronger typing), but they’re all solving the same fundamental problem: define workflows, track executions, handle failures, pass data between steps. Airflow’s XCom for sharing data between tasks? That’s intermediate results by another name. This space alone could fill several blog posts comparing trade-offs.
Cloud-Native Workflow Services
Every major cloud provider offers managed Process Managers. AWS Step Functions is particularly interesting because it makes the state machine explicit—you literally define states and transitions in JSON (Amazon States Language). What the EIP book calls “process definition” becomes a first-class artifact you can version, test, and visualize. Azure and GCP have their equivalents, each with different integration stories into their respective ecosystems. If you’re building on cloud infrastructure, these managed services handle the operational complexity of running workflow engines at scale.
Application-Level Workflow Engines
When you need workflows embedded inside your application rather than orchestrated externally, engines like Temporal shine. Your order fulfillment workflow lives in the same codebase as your order service, written in the same language, with the same debugging tools. Temporal handles the hard parts—durable execution, automatic retries, visibility into running workflows—while you write what looks like normal code. Camunda takes a different approach with BPMN visual designers, bridging the gap between business analysts who design processes and developers who implement them. Each of these engines deserves its own deep dive; the design decisions and trade-offs are fascinating.
What’s Next
We’ve built a Process Manager that coordinates workflows, tracks state, and maintains message history. But how do you observe what’s flowing through your messaging infrastructure without disrupting it? And how do you manage the system itself—health checks, configuration changes, administrative commands?
Next up: Wire Tap and Control Bus. Wire Tap lets you peek into message channels for monitoring, debugging, and auditing without affecting the flow. Control Bus uses messaging to manage the messaging system itself—a meta-pattern where commands like “pause this consumer” or “check system health” flow through the same infrastructure as your business messages. Together, they’re how you make distributed systems observable and operable.
See you next time! 🎄
Part of the Advent of Enterprise Integration Patterns series. Code available in routing_examples. Patterns from Enterprise Integration Patterns by Gregor Hohpe and Bobby Woolf.